- Scientifically attributing extreme weather events like floods or drought to climate change versus other natural processes or human activities is tricky.
- But since 2014, the World Weather Attribution, an international network of researchers, has pioneered methods that allow them to understand the role of human-induced climate change in current extreme weather events, if at all.
- Mongabay’s Kristine Sabillo recently spoke with WWA researcher and environmental statistician Clair Barnes to learn more about how WWA conducts its rapid analyses.
Human activities have been the major driver of climate change since the advent of the Industrial Revolution in the mid-1800s. As greenhouse gas levels, primarily carbon dioxide due to the burning of fossil fuels, have increased in the atmosphere, Earth’s air and oceans have warmed in response — and scientists have warned this warming is shifting weather patterns and can make extreme weather like heat, drought and floods worse. But scientifically attributing extreme weather events to climate change versus other natural processes or human activities has been tricky.
Since 2014, the World Weather Attribution, an initiative of researchers from around the world, has pioneered methods that allow them to understand if human-induced climate change had a role to play in current extreme weather events.
Mongabay has reported on several such WWA rapid attribution studies, from the deadly 2025 rainfall in the U.S. to the 2023 Amazon drought. Recently, Mongabay’s Kristine Sabillo sat down with WWA researcher and environmental statistician Clair Barnes, from Imperial College London’s Grantham Institute–Climate Change and the Environment, to learn more about the WWA’s rapid analyses.
The following interview has been lightly edited for length and clarity.
Mongabay: Can you explain how WWA started and what kind of extreme weather events trigger a rapid attribution study?
Clair Barnes: Attribution studies have been done for a long time, but they would typically go through the peer-review process, which takes a very long time. So by the time the studies would come out, everyone had forgotten about the event. Everyone might have made up their mind whether it was climate change or not.
The idea behind World Weather Attribution was to look at high-impact weather events and to use the latest science to say something while the conversation is still going on. To contribute to that discussion of, “Is it climate change? Are there other factors? What went into causing those impacts?”
The way we work is that we have partners in the Red Cross Red Crescent Climate Centre, and they monitor various emergency and disaster alerts channels. And when there is an event that has major humanitarian consequences, they will issue what we call a “trigger” to our internal mailing list, to the core team. And we get together once a week, to look at those triggers and decide which of those events we want to study. Depending on what kind of event we’re looking at, we would consider different kinds of triggers.
For a heat wave, you might look at record temperatures being set in the region. If we’re looking at a flood, it would be a certain number of people killed or a certain number of people displaced. And when I say a certain number of people, it may be an absolute number of people, or it may be a proportion of the population. Because obviously if we only look at events that impact more than a million people, you’re immediately ruling out a lot of smaller nations or less populous areas that may still be really badly impacted.
Those trigger criteria have been tweaked over the years to try to make sure we are picking up the most impactful events. So, what would make us choose one event over another? If there’s a huge amount of media interest, and we know that that discussion is going to be a very active one, we will try to contribute to that because that’s really important. But also there may be events that nobody is really interested in, but we say, No, it’s important that someone studies this because the region isn’t often studied,” or that hazard isn’t often studied in that region.

Mongabay: For many of your studies, you’ve partnered with local experts and institutions. How does that work?
Clair Barnes: We will always try to work with local experts because for a lot of us our training isn’t even in meteorology. I’m a statistician by training, so I don’t know what are the most relevant physical features when we’re trying to define the area of interest: Do we need to include these mountains? Or exclude these mountains? So we really need to work with local experts to understand the meteorology and the kind of processes involved in these events.
Finding local partners can be difficult. We’re very lucky now because we are now quite well established. We’ve got a good network. Usually what will happen is we’ll say, “We’re going to do a study,” and we will put out an email to our mailing list of people that have expressed an interest in joining future studies. Often someone will come forward from that. But if not, it’s a case of getting together in a meeting and saying, “Do we know anyone?” or “Do we know anyone that knows anyone?”
There are parts of the world where it’s really hard to find people to work with. When trying to get access to the local weather station data, we really need local people to help us. And it’s not always possible to get that data, even with people from the local meteorological services. But that data tells us things about the event and about the preceding conditions and what’s really happening on the ground that we just have no other way of finding out from our little office in central London.
Mongabay: How long does a rapid analysis usually take?
Clair Barnes: We’re usually aiming to get a report out within a couple of weeks of an event happening, because if you leave it much longer, unless it’s a really big event, people have just moved on. We might be able to do a rapid heat wave study in three or four days, but that would be a slightly more constrained version. If we’re doing something really big and really complex, like when we analyzed the Los Angeles wildfires in January, that actually took about three weeks, because we had five different strands of evidence that we brought together.
It’s important to get these reports out, not only to say, “Actually it was climate change,” but sometimes to say, “Actually, we’re not seeing evidence that climate change was what caused these terrible impacts. Maybe it’s that the infrastructure wasn’t maintained.” It’s highlighting the role of climate change when it’s important, but also avoiding this kind of blame game of saying, “Oh, it was climate change, there’s nothing we can do about it,” when actually maybe with a greater political will, there would be something: maintaining infrastructure, early warnings.
Mongabay: How do you measure the influence of human-induced climate change in an extreme weather event?
Clair Barnes: There are lots of different ways of doing attribution, and there are lots of groups doing other things, which is very cool. We do something called probabilistic attribution, which just means we use statistical models.
When we decide we’re going to study an event, let’s say there’s been a storm, we work out the exact area affected, maybe a river basin that received most of the rainfall — that’s the area we’re going to look at. Let’s say it rained for three days, and that was what caused the flooding. We’ll then look at the maximum three-day rainfall for that season in that area over the past years.
We’ll look at different observation-based rainfall data products, which give us a couple of different estimates of what that wettest three-day period in that region over the past years has looked like. Then we use a statistical model called a regression model to see how the rainfall values depend on Earth’s global mean surface temperature over the years. We know that human emissions are responsible for the recent increase in global mean temperatures.
The statistical models tell us how rainfall intensity has changed with temperature. For example, we might be able to say that for every degree Celsius of warming, rainfall of this kind has gotten 7% more intense or 20% more intense. So let’s say there was 100 millimeters of rainfall, and we say, “OK, in this statistical model, in the current climate, we would expect in any given year, there’s a 1% chance of exceeding that amount of rainfall.” Most people don’t like dealing with percentages, so we normally express that in what’s called a return period: an event with a 1% chance of occurring in any given year has a return period of 100 years. That doesn’t mean if it’s just happened, it’s going to be another 99 years, then it’s going to happen again. It’s just a different way of expressing those percentages.
We also project back to a pre-industrial climate using the statistical regression model. Maybe in a cooler climate, there was a 0.5% chance of such a heavy three-day rainfall event happening. The ratio of those two chances tells you how much more likely the rainfall event is now in the current climate than in a pre-industrial climate.
Sometimes if there’s a change, we don’t necessarily know that it’s just global warming causing that change. Land-use changes like deforestation could also influence rainfall patterns. You can’t necessarily split those effects out using just observations. To isolate the effects of climate change we use climate models, where you can run scenarios where only greenhouse gas emissions are changing.
We try to use lots of different types of climate models from different sources. Then we combine the models’ results with the statistical results from the observations to come up with an overall estimate of how much climate change influenced the event.
But a climate model is a simulation of a plausible world, it’s not necessarily trying to replicate the real world closely. Some models work well in some regions for some things, and different models work better in other regions for other things. For example, some models might do well for summer rainfall in the U.K., but not winter rainfall. And sometimes all of the models available for a region are terrible. We’ve also had cases where all of the observations are terrible. We tried to do a study on the terrible flooding around the Lake Kivu area in Rwanda and the Democratic Republic of Congo. We looked at five different observational data, and they all showed rain happening in different places on different days, and we just eventually had to say, “We can’t say anything about this event.”
There are a lot of different models for some parts of the world, like Europe. They’re really high resolution. But you can’t say as much about Africa, because that’s not where the modeling money has historically focused, so we don’t have as many models to work with.
Mongabay: Have you called for more observational data to help with such analysis?
Clair Barnes: It’s going to be really difficult to resolve that, because we’re talking about historical data that’s missing.
There are parts of the world where the records exist only in paper form, and there are raw data rescue projects going on. But if that data doesn’t even exist, there’s nothing you can do. It’s very difficult.
Mongabay: Did you expect such gaps in the global data?
Clair Barnes: It’s not something that I expected. You do learn a lot in statistics courses about bad data, missing data, what can cause missing data, all of these things. But to actually run into it on such a frequent basis, it is shocking.
Now that we have satellites, people don’t think we need observing stations on the ground. Even in North America and Europe, the number of actual stations producing data has dropped over the last 40 years. So you just have to trust what’s coming out of your satellites, which you hope is correct. But obviously the satellites aren’t really measuring how much water is hitting the ground. They’re using a model to infer how much it’s rained.
Mongabay: What are the future plans for these rapid analyses?
Clair Barnes: There are lots of groups now that are doing such attribution studies, including lots of national meteorological services, which hopefully should take some of the pressure off us needing to do certain studies. But they’ve got a very regional focus. And I do wonder whether, as these operational services come online, there’s just going to be more coverage of the Global North and not so much of the Global South.
One of the things that we’re keen to do is to try to increase attribution capacity in those regions that are underrepresented. I think there is still a place for us to keep doing what we’re doing, to support and highlight those regions that are still underrepresented, but where some of the worst impacts are occurring.
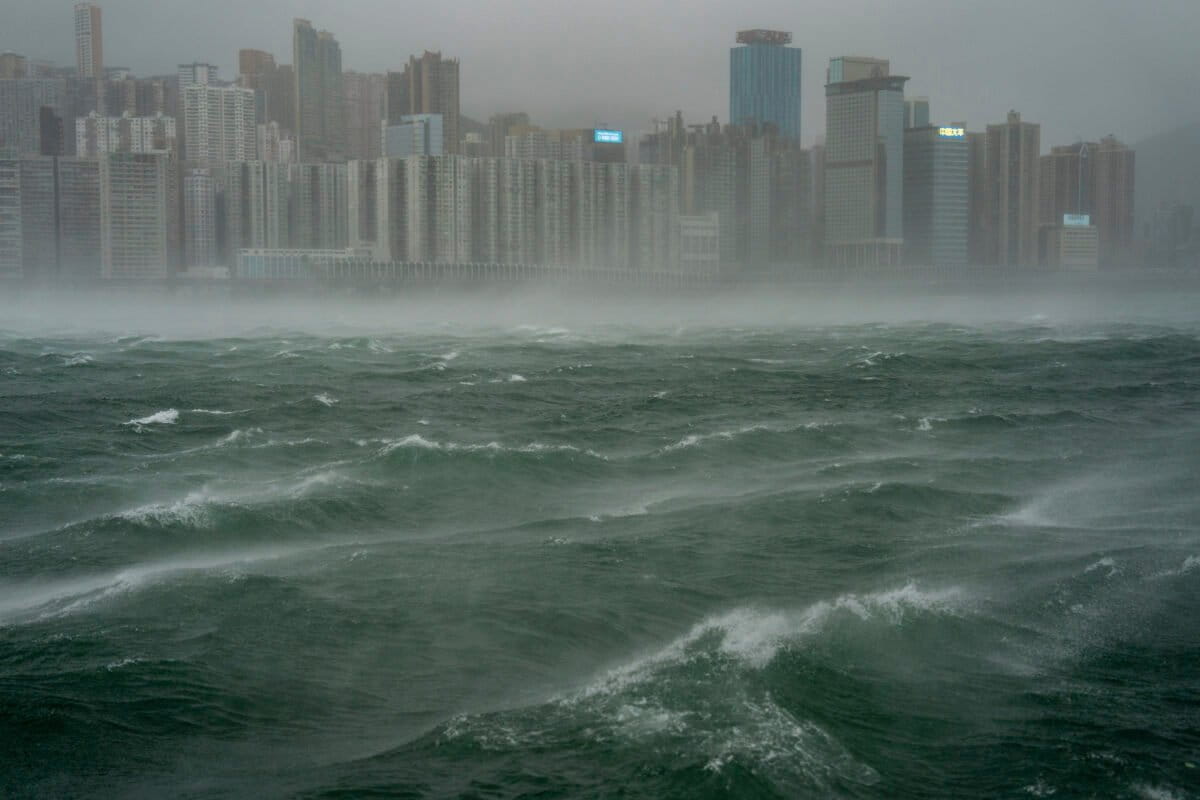
Banner image of waves near Hong Kong’s Victoria Harbour following Typhoon Wipha, July 20, 2025. Image by AP Photo/Vernon Yuen.